How to Convert Transcripts into Data Visualizations
When it comes to not only marketing, but also journalism and various research, it is key to have the right data in order to make the right decisions and lead successful campaigns. There are different methods that can be used in order to create important marketing tools. One of the crucial tools is the so-called data visualization. This tool makes it possible to take, for example, transcripts and make marketing tools out of them. But let us first define data visualization and see how it works.
Data visualization is a very useful tool which shows different data in a graphical format. To do this it uses charts, maps, infographics and various others visuals and graphics. The main benefit of this method of putting data in a visual format is that it enables users to analyze trends and patterns from data. It is very beneficial for extracting conclusions and fostering deeper understanding. This way a huge amount of data can be presented in a coherent and logical way. It has also an extra benefit, it can look very nice when presented to other people involved in the process.
Why is data visualization used in marketing so much?
Data visualization is one of the most important marketing tools you have at your disposal, because it makes it possible to efficiently capture the interest of your intended audience. According to some studies, about 60% of people tend to be visual learners, meaning that for them the best way to consume their chosen content is through the use of visual tools. Data visualization is one of the methods to enable that.
When working with data in the field of marketing, visual communication is often used. Here we are not only talking about communication with costumers when you are launching a product and you want to present its value. Visual communication is also often used by market researcher teams, since it is an effective way to share results, and it can improve the workflow.
It is really amazing how much data is produced by some business on a daily basis: emails, chats, articles, surveys are only the tip of the iceberg. It is hard to have an overview over this huge digital footprint. This is especially true if you also take all the vast audio data into consideration, for example recordings of interviews or focus groups. All the data that is captured in an audio format is often very valuable for research purposes. However, one of the main problems with audio formats is that it often becomes a tremendous task to go through all the hours and hours of audio files. Our suggestion is to transcribe the audio data and make searchable written documents out of it. Gglot is a transcription service provider that can help you with this task, so consider this step taken care of. We offer very fast and reliable transcription of any type of audio content. It will be done by our team of skilled transcription experts, with years and years of experience in the transcription business, and we can guarantee a maximum possible rate of accuracy. When you employ our services, you can rest assured that you will get a very precise transcription, for a very affordable price, and you will be amazed how soon you will be able to read all the data contained in the audio file.
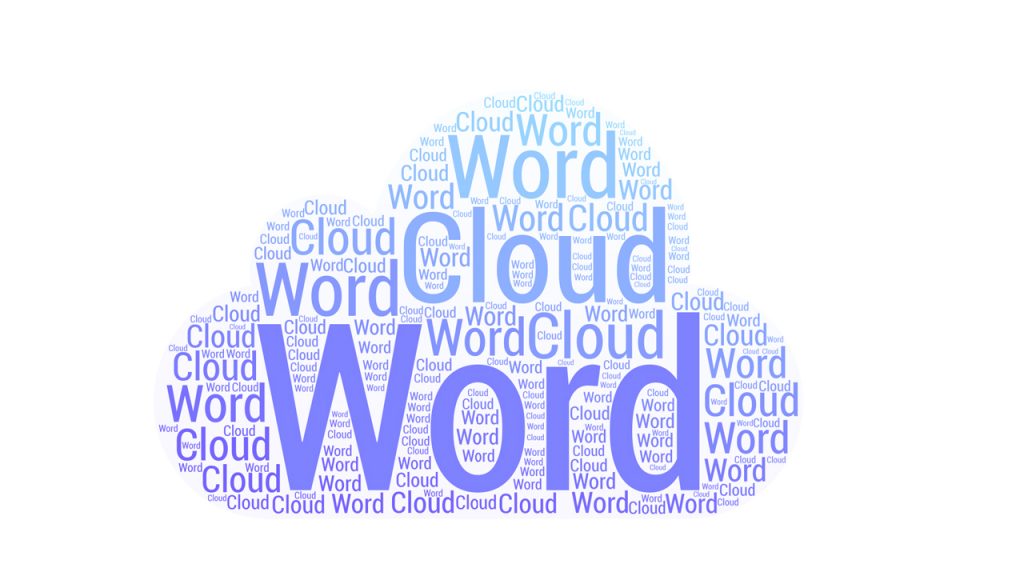
Okay, now for the next step. When you have obtained the transcript and you have the data in a written format, you need to know how you want to analyze your data. Now it is time to use text analysis tools. You can opt for uncomplicated tools, for example cloud generators. They use phrases that often come together in order to make a word cloud.
A short introduction to word clouds

A word cloud is also often called a tag cloud or wordle or weighted list. It is basically a kind of novel approach to the visual representation of the data that is in its original form a text. Word clouds are usually used for visual depiction of metadata that comes from keywords, such as tags of various websites. It is also often used for visualization of free forms of text. Tags can be anything, but most often they are in the form of single words. Word clouds work by shoving the relative importance of each such tag by different font size or the color of the font. One of the best advantages of word cloud format is its usefulness when it comes to fast perception of terms in cloud, which enables quick determination of the relative prominence of each individual term. If the term is bigger, it means that it carries more weight in regards to its significance and importance. These terms can also be used as a kind of navigation aid for websites, and in this case the terms are usually hyperlinked, which means that they are used as items that are linked, associated with the tag itself.
One more thing that is important to note when it comes to topic of word clouds, is that it could be said that word clouds are usually subdivided into three main types, regarding their applications of that tag cloud in the software itself. In this subdivision, they are divided by their meaning, instead of the more typical division by appearance. The first type of word cloud uses tags to show the frequency, how much each item is used, how much it is prominent in the website. When it comes to the second type of word cloud, it is distinct from the first one because it uses a sort of global tag clouds, and in this type of tag cloud all the relevant frequencies are aggregated, they span all items and users. It could be said that the second type of word cloud in a way represents the overall number of various items which have had the tag applied to them, and as such it is used to represent the relative popularity of each tag.
There is also the third type of word cloud, and in this type of the cloud categories their individual size is an indicator of total number of distinct subcategories that they include. This type of word cloud uses tags as a kind of categorization method which represent the items of each content piece.
One more thing that is important to note when it comes to keyword cloud is that is often used also as a kind of search engine marketing (SEM) term. In this use it will refer to a particular group of keywords, all of which are in some way relevant when it comes to the discussion of a specific website.
Tag clouds have recently gained a lot of popularity when it comes to search engine optimization. They are also very useful as tool for better navigation of the content of webpages. When used efficiently on a web page, they can help connect the resources of that website, which is very useful for better online visibility and improved search engine rank.
Advanced visualization tools
We hope you liked our short description of word clouds as one of the most important visualization tools that can bring a lot of benefits when it comes to online marketing and better visibility of your content. However, this is not the end of the story. When it comes to the visualization of data, you can use many other tools, some are more complex than other, it all depends on your particular needs and demands. Some of the more advanced tools have become so sophisticated, and through the use of advanced algorithms and deep learning they are even able to read, interpret emotions out of a text. This process is called sentiment analysis. These tools are based on machine learning algorithms which assemble data from emails, tweets, transcripts and other sources. The data are then sorted out in line with their polarity (positive, neutral, negative) or feelings (happiness, irritation, dissatisfaction etc.). For example, if you want to analyze data from a review of a certain product, the algorithm can classify what people say about the features of the product as positive, neutral or negative. So, sentiment analysis is often used in market research in order to have a better understanding of customers perceptions of the product. It is a tool which is also used in brand monitoring or social media and much more.

After the analyzing phase, you are probably left with spreadsheets which need to be turned into visualizations. If you chose to make graphs for example you can simply use tools which are already part of spreadsheet platforms such as Excel. If you are keen to create more sophisticated data visualizations, you can turn to Flourish. The best option is to explore different tools and see which are the best for your case. We hope you have a lot of fun exploring all the different ways through which you can turn your data into interesting visuals, which will definitely help your online visibility and overall user satisfaction.